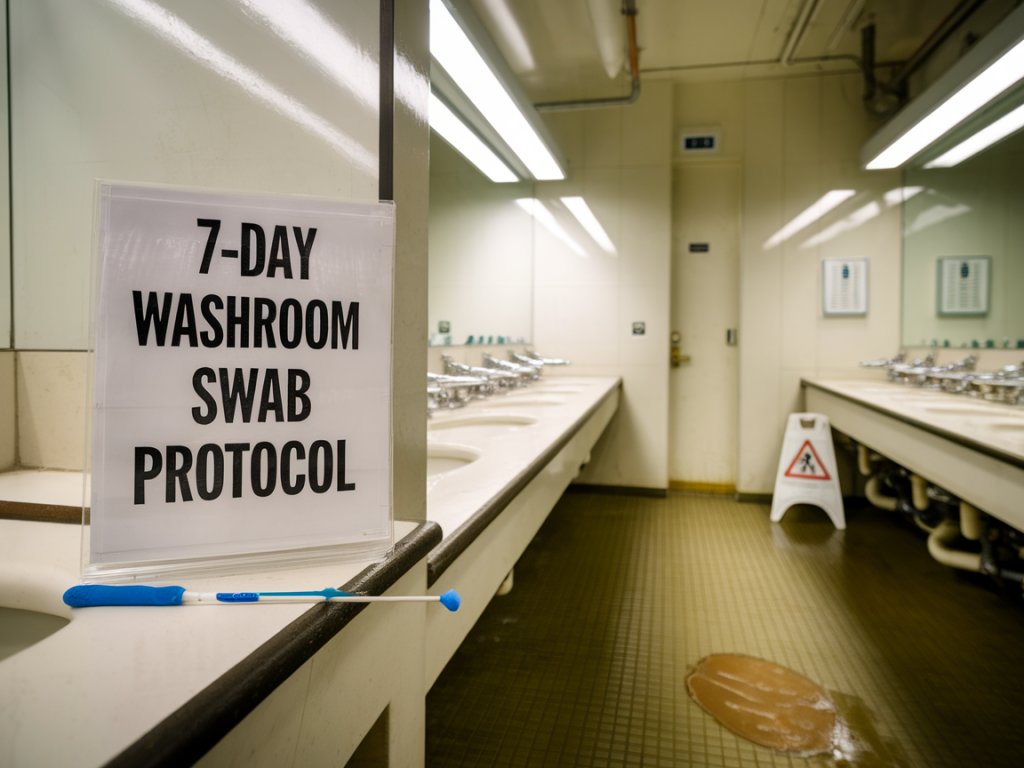
I ran a 7-day washroom swab protocol at a medium-sized office building after a facilities manager asked a blunt question: “How do we know our cleaning actually works?” What started as a simple assurance check quickly revealed hidden gaps in technique, frequency, and product choice — and gave us a direct roadmap to fix them. In this case study I’ll walk you through how I designed the protocol, the tools we used, what the data exposed, and the practical changes that closed the gaps within three weeks.
Why a 7-day swab protocol?
Many clients assume visual inspections and scheduled cleaning are enough. In reality, high-touch surfaces can recontaminate quickly, and poor technique or product mismatch can leave residues or microbial hotspots unseen by the naked eye. A 7-day swab protocol captures weekday and weekend patterns, staff cleaning variability, and the real-life recontamination rate. It’s short enough to be practical and long enough to reveal trends.
What I measured and why
I used adenosine triphosphate (ATP) bioluminescence testing (Hygiena SystemSURE Plus and 3M Clean-Trace are reliable choices) alongside targeted microbiological swabs for Enterobacteriaceae and total viable counts where necessary. ATP meters give immediate, actionable readings (RLU values) while lab swabs provide confirmatory culture data for specific pathogens.
The sample points were selected after a quick risk assessment and included:
I focused on high-touch, high-risk areas that are often missed or poorly cleaned due to awkward access or assumptions that “dispensers are cleaned by maintenance.”
Protocol design (day-by-day)
Each day we swabbed the selected points at two times: immediately before the first cleaning (to capture overnight accumulation) and within 30 minutes after cleaning (to assess effectiveness). On day 1 we also performed visual inspections and photographed each point for reference.
| Day | Sampling Times | Notes |
|---|---|---|
| Day 1 | Pre-clean, Post-clean | Baseline; visual audit and photos |
| Day 2–6 | Pre-clean, Post-clean | Track weekday patterns and operator variability |
| Day 7 | Pre-clean, Post-clean, +4hrs spot-check | Weekend/after-hours baseline and short recontamination check |
What the data revealed
There were three consistent themes in the results:
To illustrate, here’s a simplified subset of ATP readings (RLU):
| Surface | Average Pre-clean RLU | Average Post-clean RLU | Improvement |
|---|---|---|---|
| Toilet flush handle | 850 | 420 | 51% reduction |
| Tap handle | 620 | 480 | 23% reduction |
| Baby-change surface | 1,200 | 540 | 55% reduction |
| Soap dispenser push plate | 980 | 760 | 22% reduction |
Values above ~300–500 RLU (thresholds vary by device and risk tolerance) signalled poor cleaning or rapid recontamination. The wide variability between operators on the same day made it clear this wasn’t only a product issue.
How I fixed it — practical steps we implemented
After reviewing the data with the client and the cleaning team, I introduced a focused action plan based on three pillars: training, process, and product.
Results and follow-up
Within two weeks the average post-clean RLU on the previously problematic surfaces fell into acceptable ranges. The biggest gains came on tap and flush handles where improved wiping technique and a switch to an appropriate disinfectant halved ATP values in many cases.
| Metric | Baseline | 2 weeks | 4 weeks |
|---|---|---|---|
| Average post-clean RLU (selected surfaces) | 550 | 260 | 210 |
| Reported washroom complaints/week | 6 | 2 | 1 |
| Staff confidence (self-rated clean standard) | 2.8/5 | 4.0/5 | 4.2/5 |
We also continued spot ATP checks randomly twice a month and scheduled a full 7-day repeat audit after three months to ensure the process change stuck. The combination of objective measurement, hands-on training, and sensible product changes made the improvements sustainable.
Practical tips if you want to run your own 7-day swab protocol
Running this protocol has become a standard part of my audits because it exposes what words and checklists can hide. If you’re responsible for washroom standards, an evidence-based short audit like this will save time, reduce complaints, and make cleaning truly effective — not just scheduled.