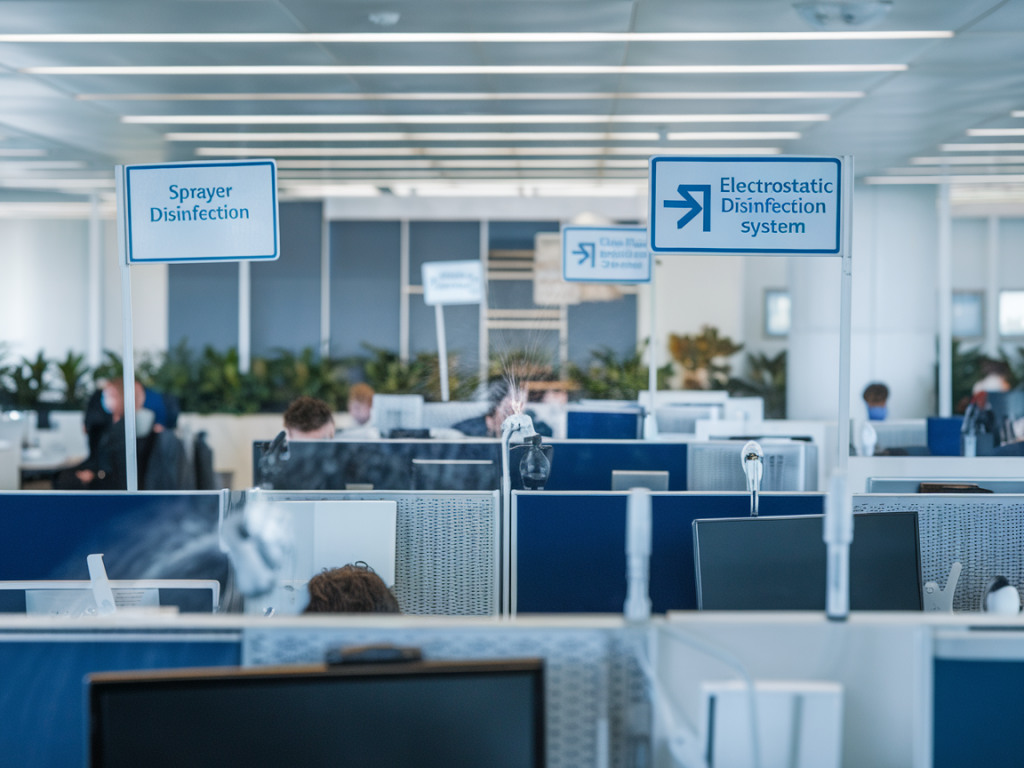
I recently ran a discreet two-week trial to compare electrostatic disinfection against conventional sprayer disinfection in a busy call centre. The client wanted hard data on operational disruption and downtime — not just manufacturer claims — so I designed a small, pragmatic study that measured door‑to‑desk downtime, agent return times, surface coverage, and staff perception. Below I share the exact approach I used, the measurements I took, practical considerations, and tips for anyone looking to replicate a similar trial in a sensitive environment.
Why run a discreet trial — and why in a call centre?
Call centres are an ideal place for this kind of comparison. They have a high density of workstations, frequent contact points (headsets, keyboards, desk surfaces), and minimal tolerance for prolonged downtime because every minute an agent is offline directly affects service levels. The client needed a solution that improved infection control but didn’t cause excessive interruption to operations or generate negative feedback from staff.
High‑level design of the two‑week trial
I split the trial into two one‑week phases. Week A used electrostatic disinfection (battery‑powered handheld electrostatic sprayers), and Week B used a conventional pumped sprayer + trigger applicator workflow. The test was deliberately discreet: agents were informed there would be “enhanced cleaning activities” but not the comparative nature of the trial — this preserves normal behaviours and reduces bias in staff feedback.
Key parameters I focused on:
Preparation and approvals
Before anything else, I secured written sign‑off from site management and HR. Even when discreet, you need transparency with senior staff and compliance with COSHH and the site’s health & safety policies. I prepared:
Equipment and products used
It’s worth listing the exact kit so the trial is reproducible:
Trial schedule and operational protocol
I ran both phases during the same shift pattern to keep variables consistent. Each cleaning run followed the same sequence: entrances and reception first, then rows of desks in blocks of 10, shared spaces (kitchens, meeting rooms), and finally toilets and touchpoints.
| Phase | Cleaning method | Typical downtime per desk (target) | Verification |
|---|---|---|---|
| Week A | Electrostatic spray + no wipe on most surfaces | 2–3 minutes | ATP pre/post, fluorescent markers |
| Week B | Conventional sprayer + microfiber wipe on headsets & keyboards | 5–8 minutes | ATP pre/post, fluorescent markers |
For electrostatic, the protocol was to spray from 1–2 metres and allow the stated contact time. For sensitive equipment (monitors, keyboards), we either used an approved wipe or electrostatic product labelled safe for electronics. For the conventional method, we sprayed and immediately wiped high‑touch points to simulate standard practice.
Measuring downtime and operational impact
Downtime measurement must be simple and auditable. I used two approaches:
During the electrostatic phase, agents typically returned within 2–3 minutes. The mist dries quickly and the product is designed for short contact times when used at recommended concentrations. The conventional phase often required cleaners to spend longer wiping keyboards and headsets, and agents were asked to wait until surfaces were visibly dry — extending the downtime to 5–8 minutes on average.
Surface coverage and microbiological verification
I always advocate objective verification rather than relying on smell or appearance. I placed fluorescent markers on 30 predefined high‑touch points (mouse, keyboard, headset earpad, desk edge) across the floor and ran ATP swabs on 60 checkpoints (30 pre‑clean, 30 post‑clean) each day.
Results pattern:
These differences suggested electrostatic offered better and more consistent coverage on vertical and undersides of surfaces without requiring physical contact, while the conventional method depended heavily on cleaner technique.
Staff perception and anecdotal feedback
I ran a short anonymous survey each Friday: three quick questions about odour, perceived safety, and whether the cleaning disrupted their work. Response rate averaged 62%.
Labour and consumable costs
It’s important to capture the wider operational cost picture. While electrostatic equipment has higher capital and maintenance costs, labour hours can be lower because the method covers more area per minute. In this trial:
Practical challenges and lessons learned
Data I recorded and how I analysed it
Every day I collected:
I used simple descriptive stats: mean and median downtime per method, percentage of fluorescent marker removal, and average ATP reduction. I also plotted downtime incidents across the day to see if there were clustering effects (e.g., morning peak more sensitive to disruption).
Overall, the data favoured electrostatic for lower downtime and more consistent surface coverage, with conventional methods performing well where high‑contact items were physically wiped. The choice in practice will depend on priorities: lowest downtime and consistent coverage (electrostatic) vs. lower capital outlay and tactile cleaning reassurance (conventional).
If you’d like, I can share the Excel template I used to log timings, ATP results, and survey responses — it makes running a comparable trial simple and repeatable for any multi‑site rollout.