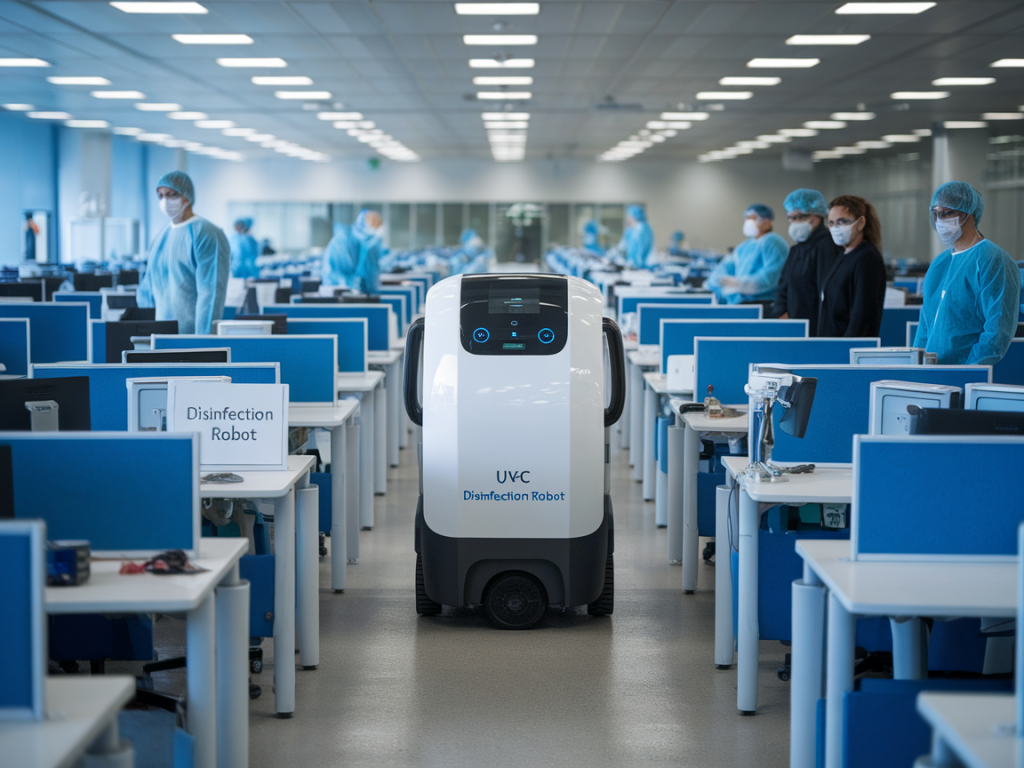
I ran a 30‑day trial of a UV‑C disinfection robot in a 200‑desk office to test whether the technology would deliver measurable microbial reduction and be practical for day‑to‑day cleaning operations. Below I share the exact approach I used, the sampling plan, safety and operational steps, how we measured results, and the kind of evidence you can present to stakeholders. This is a practical, repeatable protocol you can adapt whether you’re evaluating a brand like Xenex, Truvox, or a smaller manufacturer.
Why run a 30‑day trial?
Thirty days gives you enough time to: capture variability in daily occupancy and cleaning routines, gather multiple pre‑ and post‑treatment samples, and assess operational integration (scheduling, staff training, health & safety). Shorter pilots often produce noisy data that’s hard to interpret; longer pilots can be costly. Thirty days is a pragmatic balance that lets you demonstrate consistent microbial reduction and build a business case.
Trial objectives and success criteria
Before switching the robot on, define clear objectives. Ours were:
- Primary: Demonstrate a statistically significant reduction in surface microbial load (CFU/area) after UV‑C deployment compared with baseline and control areas.
- Secondary: Show repeatability across different zones (open plan desks, meeting rooms, kitchenettes), evaluate cycle time and room turnover impact, and confirm safe operation with zero UV exposure incidents.
- Success threshold: ≥1 log10 (≈90%) average reduction in total aerobic CFU on high‑touch surfaces within 24 hours of UV‑C treatment, and no adverse safety events.
Site selection and zoning
We mapped the 200‑desk office into zones so we could compare treated areas with untreated controls:
- Zone A — Open plan desks (100 desks) — treated
- Zone B — Open plan desks (50 desks) — untreated control
- Zone C — Meeting rooms and phone booths — treated
- Zone D — Kitchenette and high‑traffic touchpoints — treated
- Zone E — Reception and occasional use areas — untreated control
This zoning allowed us to account for differences in traffic and use patterns. Treated and control zones were comparable by footfall and occupancy.
Baseline assessment
Collecting robust baseline data is essential. We used three complementary methods to characterise microbial load and organic soiling:
- Contact plates / swab cultures: Tryptic Soy Agar swabs for surface CFU counts, incubated 48–72 hours.
- ATP bioluminescence: Hygiena EnSURE ATP meter to measure organic residue in RLU (useful for quick, daily checks).
- Air sampling (optional): Impaction sampler to measure airborne CFU in meeting rooms and the open plan.
For baseline we sampled 10 fixed points per zone (desk armrests, keyboard tops, phone handsets, meeting room tables, kitchenette handles). Each point had three baseline readings over one week to capture variability. We logged sample location, surface type, time since last cleaning, and the responsible cleaning shift.
Operational protocol for the UV‑C robot
We ran the robot during the cleaning window (evening) to avoid occupant exposure. Key steps we documented and trained staff on:
- Pre‑check: ensure no occupants, place safety barriers and signage, confirm emergency stop function.
- Placement & cycle planning: robot uses line‑of‑sight UV‑C. We positioned it centrally in rooms and used multiple positions for large open plan zones, following manufacturer recommendations for dose and distance.
- Cycle duration: typical cycles were 5–15 minutes per position depending on distance; total treatment time per open‑plan segment averaged 45–60 minutes including repositioning.
- Safety: wear UV‑C protective eyewear if interaction required, use interlocks, and log every activation with operator initial, start/end time, and any anomalies.
Sampling strategy during the trial
To demonstrate effect and repeatability we used a paired sampling approach: take a pre‑UV sample and a post‑UV sample from the same surface so each sample acts as its own control. Sampling cadence:
- Day 0–7: Baseline sampling (3 samples per point over week)
- Days 8–37 (30‑day trial): Twice weekly paired sampling on the same 10 points per treated zone; weekly sampling in control zones.
- Day 15 and Day 30: Extended sampling with ATP, swabs, and air sampling for comprehensive snapshots.
We tracked environmental factors (temperature, humidity) because they can affect microbial recovery.
Data management and analysis
We kept a central spreadsheet and used simple stats to show effect sizes:
- Calculate mean and median CFU counts pre‑ and post‑treatment
- Compute log10 reduction and percent reduction for each paired sample
- Use a paired t‑test or Wilcoxon signed‑rank test (non‑parametric) to assess statistical significance across all pairs
- Compare treated zones versus control zones over the same period
Here’s an example table layout we used to summarize weekly results:
| Zone | Sample Point | Baseline mean CFU | Post‑UV mean CFU | Mean log10 reduction | % Reduction |
|---|---|---|---|---|---|
| Zone A | Keyboard top | 230 CFU | 20 CFU | 1.06 | 91% |
| Zone C | Meeting table | 150 CFU | 15 CFU | 1.00 | 90% |
Interpreting results and common pitfalls
Expect variability. UV‑C is line‑of‑sight — shadowing and surface orientation matter. When a sample shows poor reduction, check these common causes:
- Shadowing from computer monitors, equipment, or chair arms
- Inadequate dwell time or incorrect distance per manufacturer’s dosing guide
- Dirty surfaces with organic load that shield microbes (ATP high despite CFU reduction indicates organic residue still present)
- Post‑treatment recontamination from cleaning staff or night contractors — ensure sequences (UV after cleaning) are followed
We also cross‑checked ATP and CFU: ATP reductions often lag CFU changes because ATP detects organic residue not just viable microbes. Use both for a fuller picture.
Safety, training and compliance
UV‑C is effective but poses risks to skin and eyes. Our safety measures included:
- Written SOP aligned to manufacturer guidance and UK health & safety rules
- Operator training and competency sign‑off (demonstration and checklist)
- Physical barriers, warning lights, and audible alerts while robot is operating
- Accident log and immediate investigation protocol for any near miss
We also coordinated with HR and facilities to communicate the program to occupants and scheduled a short awareness campaign so no one entered an area during treatment.
Cost, time and operational impact
Track the additional labour and cycle time. In our trial the robot added about 60–90 minutes of cleaning team time nightly for the treated zones (depending on number of positions). Consider these cost lines in your business case:
- Operator time per night
- Robot rental or lease cost (many pilots use a short‑term hire)
- Consumables and maintenance (bulb life, filters for some models)
- Sampling costs (lab fees for CFU cultures, ATP swabs)
If your core objective is infection control, the unit cost per percent reduction and the ability to target outbreaks will influence buy vs hire decisions.
Reporting to stakeholders
When presenting results, use clear visuals: boxplots for CFU distributions, paired dot plots showing pre/post for each sample, and a table summarising mean log reductions by zone. Include operational metrics (cycle times, incidents) and a short implementation checklist. Stakeholders care about two things: measurable microbiological benefit and operational feasibility — show both.
If you’d like, I can share a sample spreadsheet template with the sampling log, analysis formulas, and an editable SOP we used during this pilot. That makes it quick to run your own 30‑day trial and produce evidence that stands up to scrutiny.