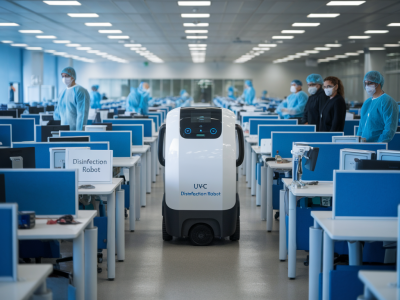
I’ve run pilots with clients where a simple product change — swapping non-biodegradable floor pads for biodegradable options — turned into measurable cost savings inside three months. If you want to build a costed green procurement comparison that demonstrates this outcome for your site, here’s the step-by-step approach I use at Bluebaycleaning Co. It’s practical, numbers-driven, and designed so you can take the figures to procurement, finance, or your sustainability lead with confidence.
Why a costed comparison matters
Procurement teams are flooded with sustainability claims. A costed comparison removes opinion and focuses on what decision-makers care about: total cost of ownership, risk, waste disposal, and operational impact. I always frame the analysis around a 12-week practical pilot because it’s long enough to show recurring costs and short enough to keep projects moving.
What you need before you start
Gather these baseline items from your site:
Having accurate baseline consumption and labour time gives your comparison credibility. If you don’t have exact figures, run a one-week usage log before the pilot.
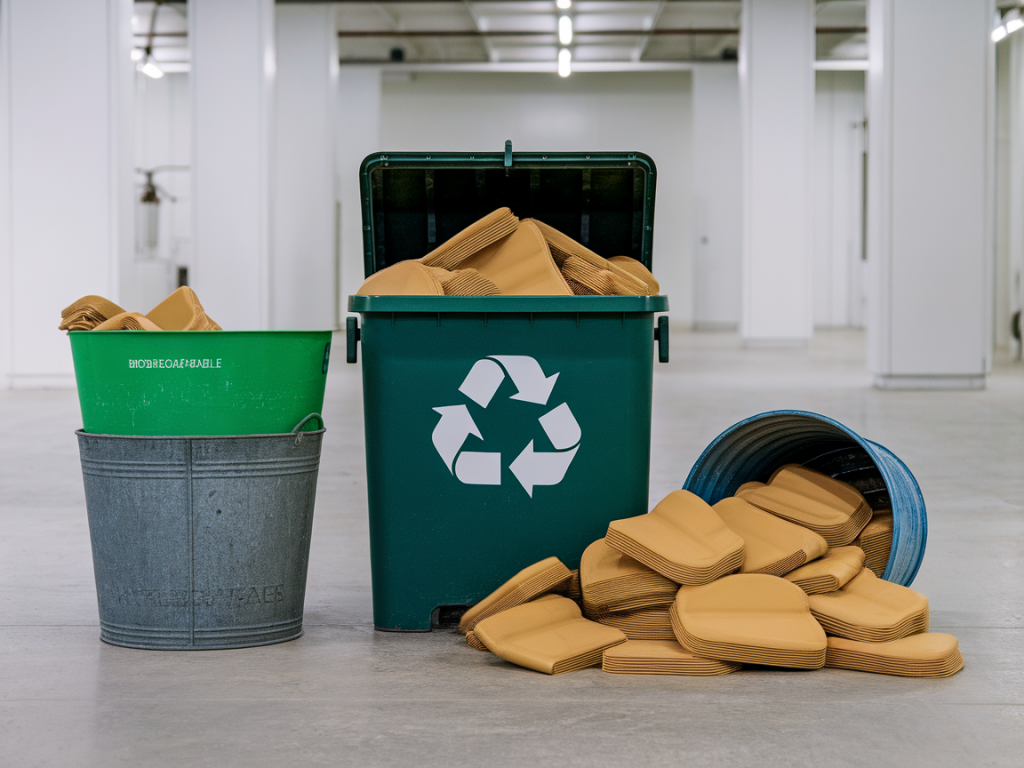
Choosing the biodegradable pad
Not all “biodegradable” pads are equal. I recommend checking:
Brands I’ve tested include O-Cedar’s biodegradable floor pads and some commercial lines from Tennant or Nilfisk partner suppliers. Always trial the pad on your machines to check performance and pad wear rate.
Build the cost model
Create a simple spreadsheet with these columns. Below is a mini-template you can paste into your sheet or website copy:
| Item | Current pads (per week) | Biodegradable pads (per week) | Notes |
|---|---|---|---|
| Units used | U_current | U_bio | Record actual weekly usage |
| Cost per unit (£) | P_current | P_bio | Include delivery and VAT |
| Weekly product cost (£) | =U_current * P_current | =U_bio * P_bio | |
| Labour minutes replacing/disposal (mins/week) | L_current | L_bio | Include bagging, carrying, and admin time |
| Labour cost (£/min) | =Labour rate / 60 | Use fully loaded labour cost | |
| Weekly labour cost (£) | =L_current * cost/min | =L_bio * cost/min | |
| Waste disposal cost (£/week) | W_current | W_bio | Skip, waste contractor or composting fees |
| Total weekly cost (£) | =product + labour + waste | =product + labour + waste | |
| Total 12-week cost (£) | =weekly * 12 | =weekly * 12 | Use this row when presenting to stakeholders |
Example with numbers — real enough to be useful
Here’s an anonymised example from a retail site I worked with. These are rounded for clarity:
Calculate:
Notice the biodegradable pad was more expensive per unit, but delivered cost savings because of better longevity, reduced labour handling and lower waste charges. That’s the core point your model needs to show: total cost of ownership matters more than unit price.
What to measure during the 12-week pilot
Make the pilot repeatable and auditable. I always collect:
Keep a photo log and short staff feedback notes — qualitative input helps procurement accept the switch.
Risk and sensitivity analysis
Procurement teams will ask “what if” questions. Be ready with simple sensitivity checks:
I usually prepare three scenarios: conservative (small benefits), expected (realistic benefits), and optimistic (best case). That builds trust.
How to present the findings
When I present to finance or procurement I include:
Be explicit about non-monetary benefits too: reduced waste to landfill, improved CSR reporting, and potential positive customer/tenant perceptions. Those factors can help secure a procurement decision even if the monetary saving is marginal.
Quick tips from the field
If you want, I can share a spreadsheet template I use that automatically calculates weekly and 12-week totals and runs scenario sensitivity. It’s an easy way to move from theory to a procurement-ready business case without re-inventing the wheel.