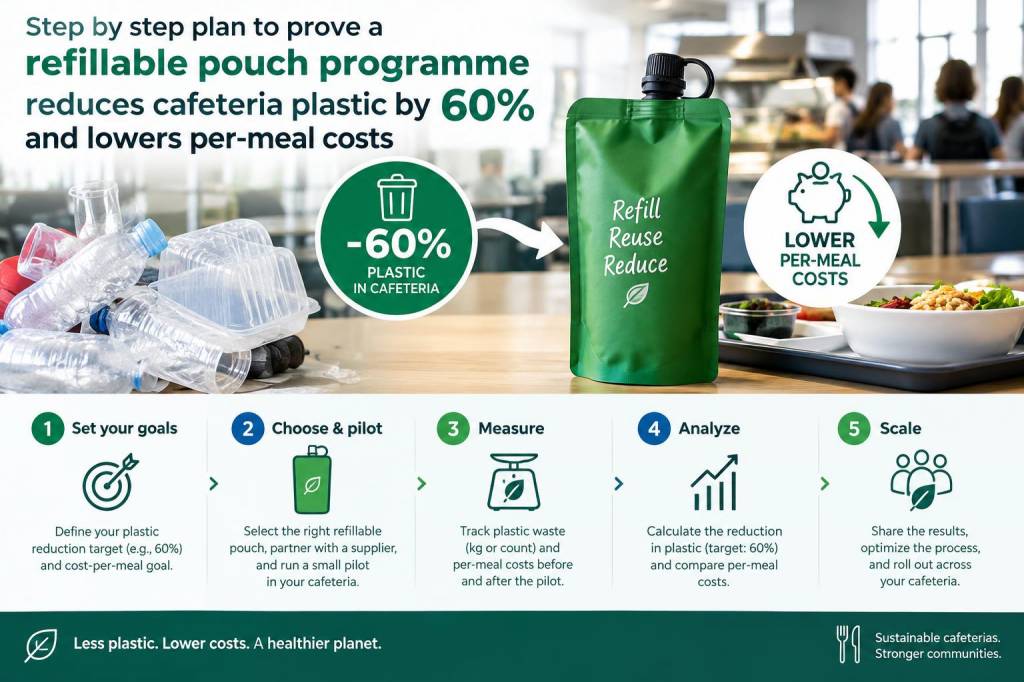
Rolling out a refillable pouch programme in a workplace cafeteria sounds like a win for both the planet and the balance sheet—but to convince senior leadership, sustainability teams, or even the catering supplier, you need clear, repeatable evidence. Below I share a pragmatic, step-by-step plan I’ve used with clients to demonstrate that a refillable pouch scheme can reduce single-use plastic by around 60% and lower per-meal costs. This plan is practical, data-driven, and tailored to UK business settings.
Start with clear objectives and scope
Before you touch a pouch, define what success looks like. My standard objectives are:
- Reduce single-use plastic for condiments, sauces, oils, and dry goods in the cafeteria by 60% within 6 months.
- Lower the per-meal material cost for these items by at least 10%.
- Collect robust measurement data to make the case for full rollout.
Decide scope: which products are in scope (ketchup, mayonnaise, salad dressings, oils, detergents for beverage stations)? Which points of sale (main cafeteria, satellite kiosks, vending areas)? Keep the pilot limited—one main cafeteria plus one kiosk is a good start.
Assemble stakeholders and assign roles
Successful pilots need clear ownership:
- Project lead (operations or facilities)—coordinates pilot and reporting.
- Catering partner—responsible for supply, refill logistics, and staff training.
- Procurement—to evaluate suppliers and negotiate pouch refill pricing.
- Waste & sustainability—to measure waste baseline and post-pilot.
- Finance—to validate cost savings per meal and capex decisions.
Baseline measurement: the foundation of proof
Collect a 4-week baseline before introducing pouch dispensers. Metrics to capture:
- Plastic volume/weight for single-use containers in scope (kg/week).
- Number of single-use containers (units/week).
- Cost of disposables for those items (purchasing invoices, £/week).
- Usage rate—meals sold in the same period (meals/week).
How to measure: ask the kitchen to segregate and store single-use containers from the items in scope. Weigh them weekly and log counts. Collect supplier invoices to reconcile unit cost and packaging cost (if separately visible).
Design the refillable pouch solution
Choose products and equipment with practicality in mind:
- Refillable pouch systems: look at brands such as Planet Pouch, RefillMe or supermarket refill pouches from Olleco (for oils) and large-format sachets for condiments.
- Dispensing hardware: wall-mounted pumps, gravity dispensers, or closed-dispense bag-in-box for liquids to reduce cross-contamination.
- Portion control accessories: calibrated dispensers or dosing pumps to stabilise per-meal usage.
Get sample pouches and dispensers. Make sure the system meets hygiene/COSHH requirements and is compatible with your catering workflow.
Pilot plan and timeline
I recommend an 8–12 week pilot with checkpoints at weeks 2, 4, 8. Key activities:
- Week 0: install dispensers, train staff, communicate to customers with clear signage about the refill scheme and portion sizes.
- Week 1–2: stabilisation—monitor dispenser performance and refill cadence.
- Week 3–8: full data collection—waste, cost, usage, customer feedback.
- Week 8–12: analysis, adjust portioning or supply frequency, final report.
Measurement during pilot: what to track
Track the same metrics as baseline plus operational KPIs:
- Plastic volume/weight from single-use containers (kg/week).
- Number of single-use containers avoided (units/week).
- Cost of refill pouches and dispensers (total and per-week).
- Refill frequency and staff time spent on refilling (hours/week).
- Per-meal usage (grams or ml of condiment per meal).
- Customer acceptance (short survey or quick poll at point of sale).
Sample data and simple savings calculation
Here’s a sample table I use to present results. Replace numbers with your actual measurements.
| Metric | Baseline (monthly) | Pilot (monthly) | Change |
|---|---|---|---|
| Plastic weight (kg) | 120 | 48 | -60% |
| Single-use containers (units) | 3,000 | 1,200 | -60% |
| Cost of packaging & disposables (£) | £600 | £300 | -50% |
| Refill pouch spend (£) | £0 | £180 | n/a |
| Total materials cost (£) | £600 | £480 | -20% |
| Meals served | 6,000 | 6,000 | 0% |
| Material cost per meal (£) | £0.10 | £0.08 | -20% |
Interpretation: The table shows a 60% reduction in plastic weight and containers with a 20% reduction in materials cost per meal. Real-world numbers will vary; what matters is the relative change and replicable measurement method.
Address hygiene, health & safety and COSHH
Make sure the refill system complies with food safety and COSHH guidance. Key points:
- Use food-grade dispensers and pouches with tamper-evident seals.
- Clean and sanitise dispenser nozzles daily and document cleaning checks.
- Store pouches in a clean, temperature-controlled area per manufacturer instructions.
- Complete a simple COSHH review for any concentrated products used in pouch form (e.g., certain sauces or cleaning chemicals for beverage stations).
Behavioural nudges to maximise reduction
How staff and customers use dispensers determines results. I recommend:
- Calibrated portion pumps to avoid over-dispensing.
- Training for serving staff on portioning and refill procedures.
- Signage explaining environmental impact (show the kg of plastic saved) to encourage responsible use.
- Incentives for customers (e.g., small discount for requesting less packaging) where feasible.
Analyse results and build the business case
At pilot end, produce a short report that includes:
- Baseline vs pilot comparison of plastic reduction and cost per meal (use the table format above).
- Operational findings: refill frequency, staff time impact, dispenser reliability.
- Customer feedback summary—any complaints or positive comments.
- Payback analysis for dispenser capex (if not provided by supplier): show months to payback from per-meal savings.
Provide recommendations: full rollout scope, supplier options, contract changes, and a risk register covering warranty, hygiene, and supply chain continuity.
Scaling and long-term tracking
If the pilot hits targets, scale in phases and keep monitoring the KPIs monthly for the first 6 months. Embed the measurement into routine waste reporting and procurement reviews so the reductions are locked in and reported as part of your sustainability KPIs.
This approach combines simple measurement, operational practicality, and clear financials—exactly the mix managers need to sign off on change. If you’d like, I can share the Excel template I use for baseline/pilot logging and the short report template to present to stakeholders.